
Introduction
Here’s a backtest of Gary Antonacci’s DMSR (Dual Momentum Sector Rotation) strategy.
The author is best known for his GEM (Global Equity Momentum) strategy, which he popularised in 2014, in his book « Dual Momentum Investing: An Innovative Strategy for Higher Returns with Lower Risk », McGraw-Hill Education.
As a reminder, GEM (Global Equity Momentum) is a strategy that is well known to investors and relatively quiet, with an average of 2 to 3 transactions per year. The strategy invests 100% in the US equity market or in foreign equities outside the USA. The criterion for selecting the market in which to invest is 12-month momentum. At the end of each month, the strategy invests in the market with the highest momentum. If no momentum is positive, the strategy is divested from the equity market and invested in a basket of low-risk bonds. The strategy can use the following ETFs: SPY, EFA, BND and BIL. When the equity market is in a positive, well-established trend, the strategy can remain invested for several years without any need for arbitrage.
You can simulate the GEM strategy here: GEM
DMSR (Dual Momentum Sector Rotation) is less known, as Gary Antonacci has never revealed the exact criteria for this strategy. It is nevertheless possible to identify them, if like me, you have followed the various publications and interviews that the author has given, since the release of his book in 2014.
So it’s the backtest, of what I’ve been able to understand of the DMSR, that I’m presenting today.
Useful information presented by the author in his reference work
« My favorite dual momentum strategy is one that rotates among the strongest U.S. stock market equity sectors. The Morningstar sectors separate the U.S. stock market into 11 non-overlapping segments. These cover technology, industrials, energy, communication services, real estate, financial services, consumer cyclical, basic materials, utilities, consumer defensive, and healthcare. »
« We can select an equally weighted basket of the top-performing sectors using relative strength momentum in what I call my Dual Momentum Sector Rotation (DMSR) model. When the U.S. stock market is in a downtrend, according to absolute momentum, DMSR moves all of its assets into the Barclays Capital U.S. Aggregate Bond Index. »
Gary Antonacci (10/2014), “Dual Momentum Investing: An Innovative Strategy for Higher Returns with Lower Risk”, McGraw-Hill Education
The characteristics of the DMSR strategy
Based on the information in his book, articles and interviews, I have defined the following conditions:
- Conditions for investing offensively or defensively: the 12-month momentum of the S&P500 (absolute mom)
- List of offensive investment vehicles: the 11 sectors that make up the S&P500 index (relative strength)
- Number of sectors to be selected when the strategy is invested offensively: 4
- Sector selection criteria: 12-month momentum
- List of defensive investment vehicles: US Aggregate Global Bond or Money Market (Cash)
- Number of instruments to be selected when the strategy is invested defensively: 1
A few more explanations
The author tells us:
« We can select an equally weighted basket of the top-performing sectors using relative strength momentum ».
- I’m going to assume that I’m investing in the first 1/3 of offensive supports, 11/3 => the first 4 supports, choosing those with the highest momentum.
- I use the 12-month momentum of the S&P500 to decide whether the market is in an uptrend or a downtrend, i.e. to invest offensively or defensively.
- If the S&P500 is in an uptrend, I invest offensively. In this case, the allocation is spread evenly over the 4 sectors with the highest 12-month momentum, 25% each.
- If fewer than 4 sectors have positive momentum, then the remainder not invested offensively is allocated to a defensive position.
- If the S&P500 is trending downwards (negative momentum), I invest defensively. In this case, I allocate the entire portfolio to US government bonds or the money market, depending on which market has offered the highest returns over the last 12 months.
- Those familiar with the GEM strategy will note that the author initially recommended using only US government bonds as a defensive asset. However, since interest rates have fallen so much over the last 10 years, since the publication of his study, it now seems more reasonable to compare the US government bond market with the performance of the money market, in order to select the market that offers the best risk/return trade-off.
- Method for calculating 12-month momentum: ( Price at the end of the month – Price 12 months ago ) / ( Price 12 months ago )
- Momentum calculations and any arbitrages are carried out at the end of each month.
The investment vehicles
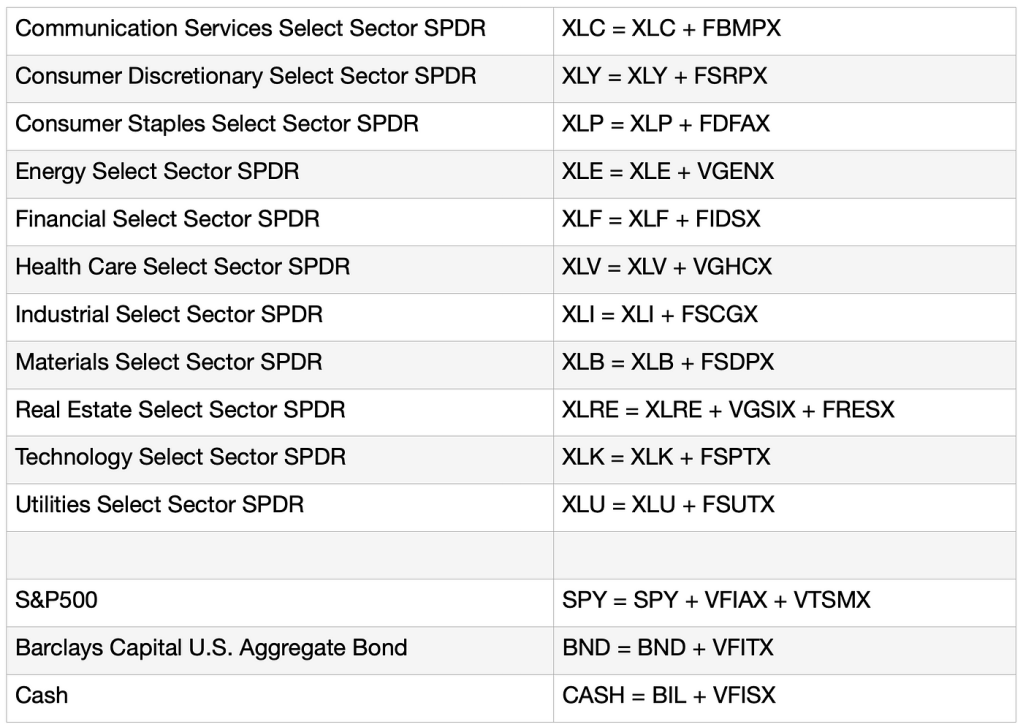
I use the Sector SPDR ETFs with the longest track record (1998).
I extend the history of these ETFs back to 1992 using the following proxy funds:
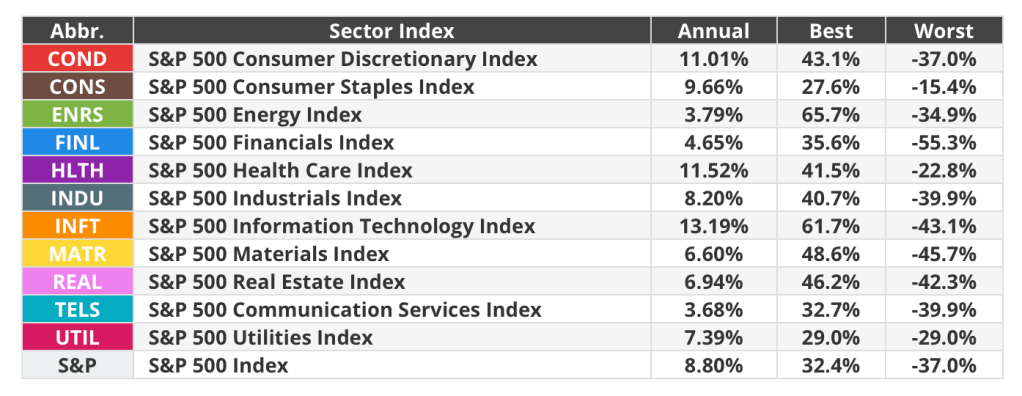
Historical performance of assets
Backtesting the DMSR strategy
For simplicity, brokerage fees, execution spreads and taxes are not taken into account. The entry and exit prices are the closing prices, adjusted for dividends.
Cumulative historical performance of the DMSR strategy
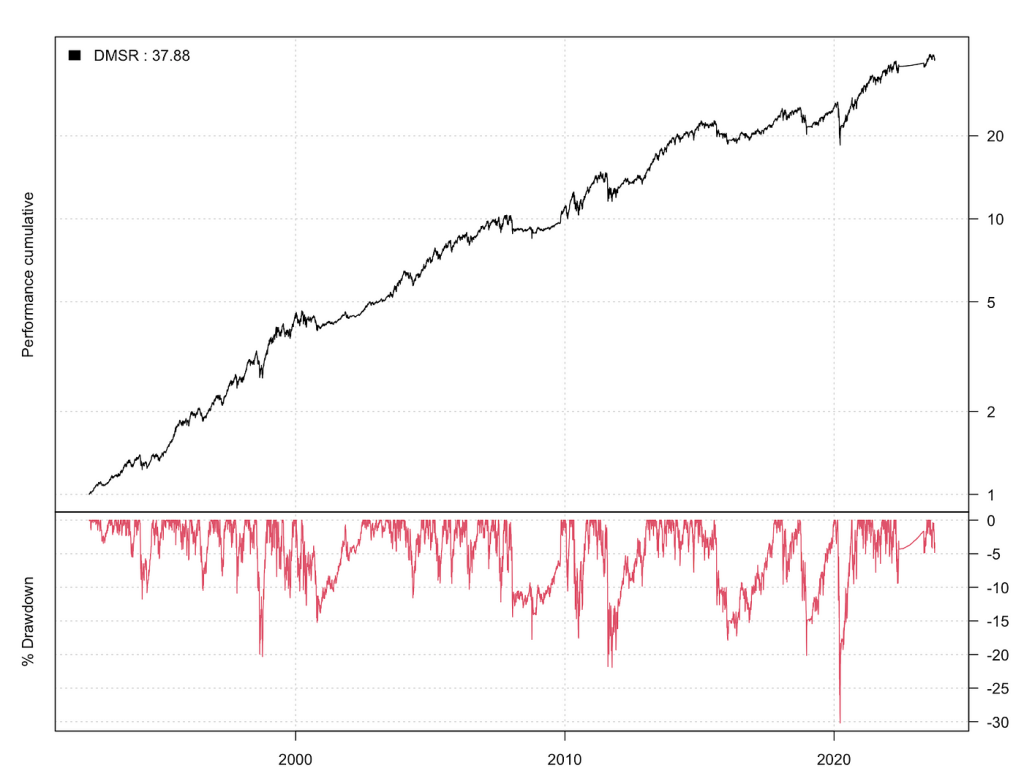
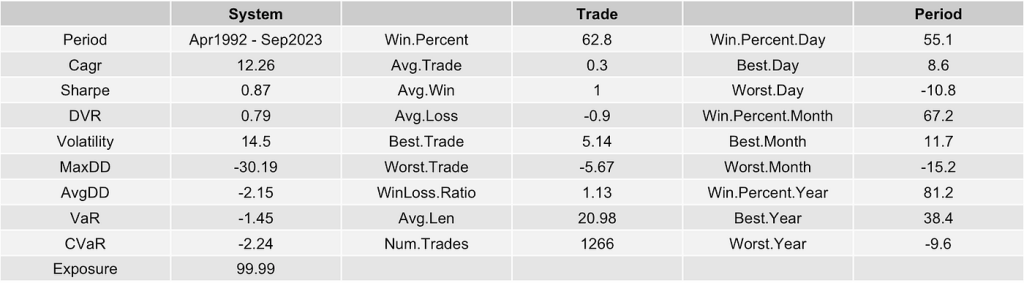
Statistical information
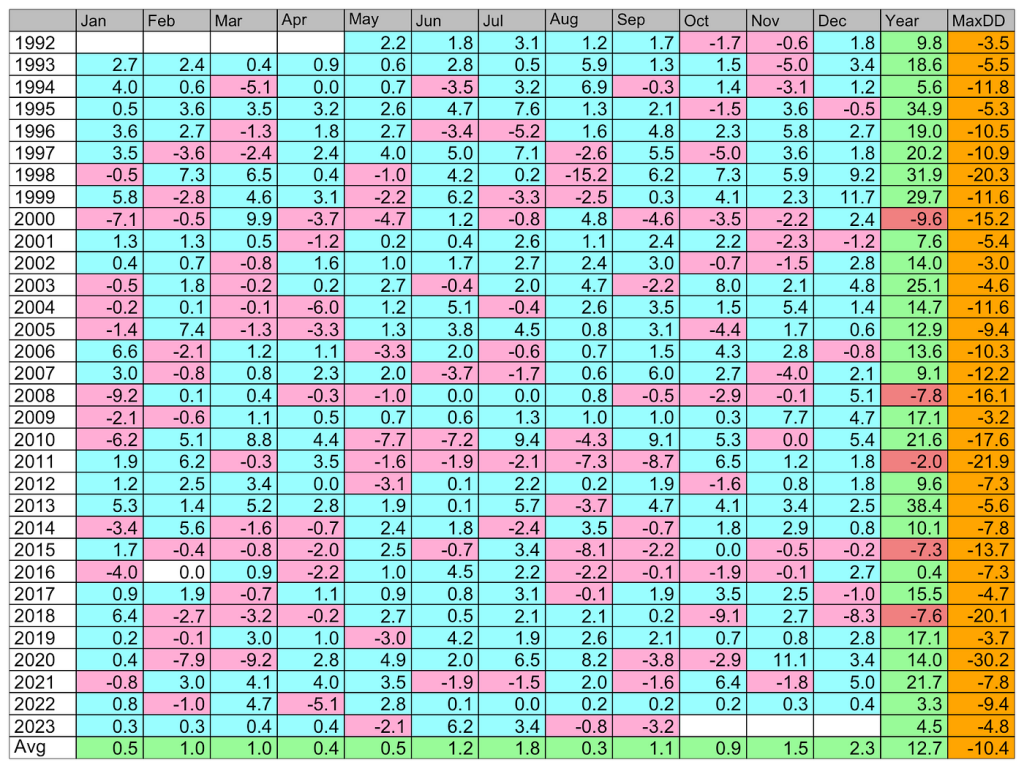
Monthly performances
Transitions periods
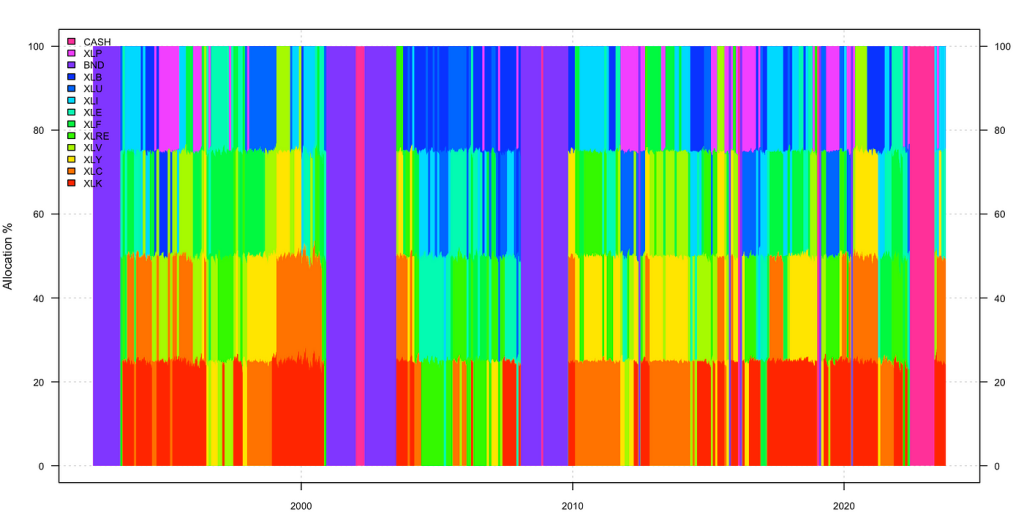
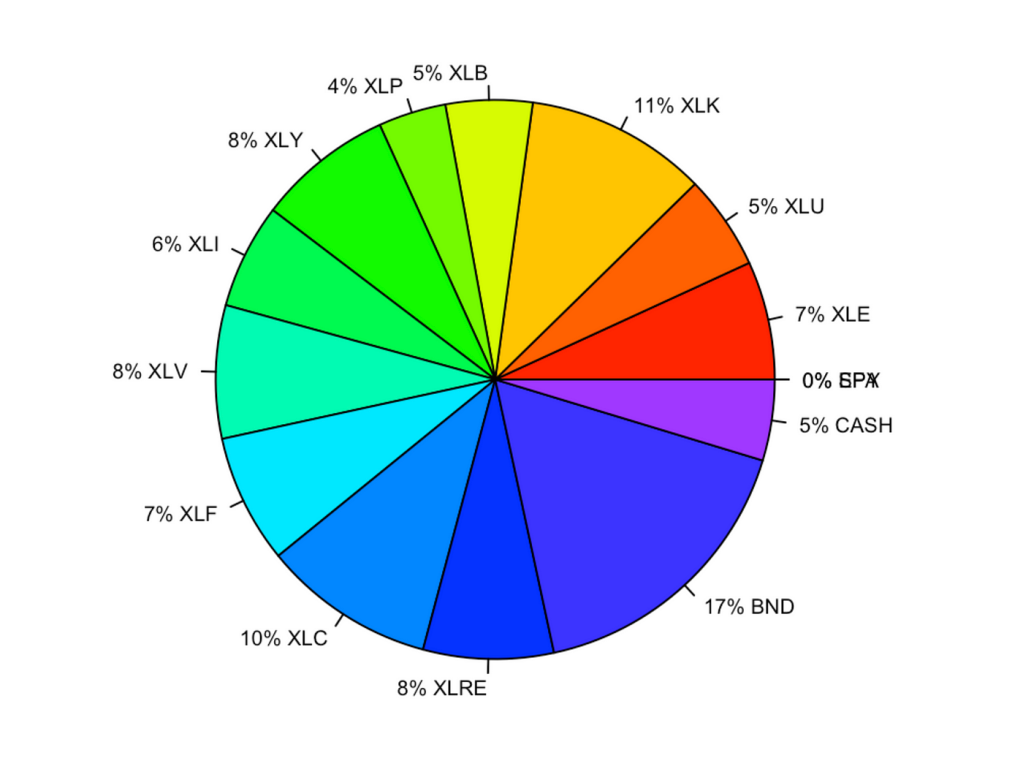
Historical breakdown of allocations
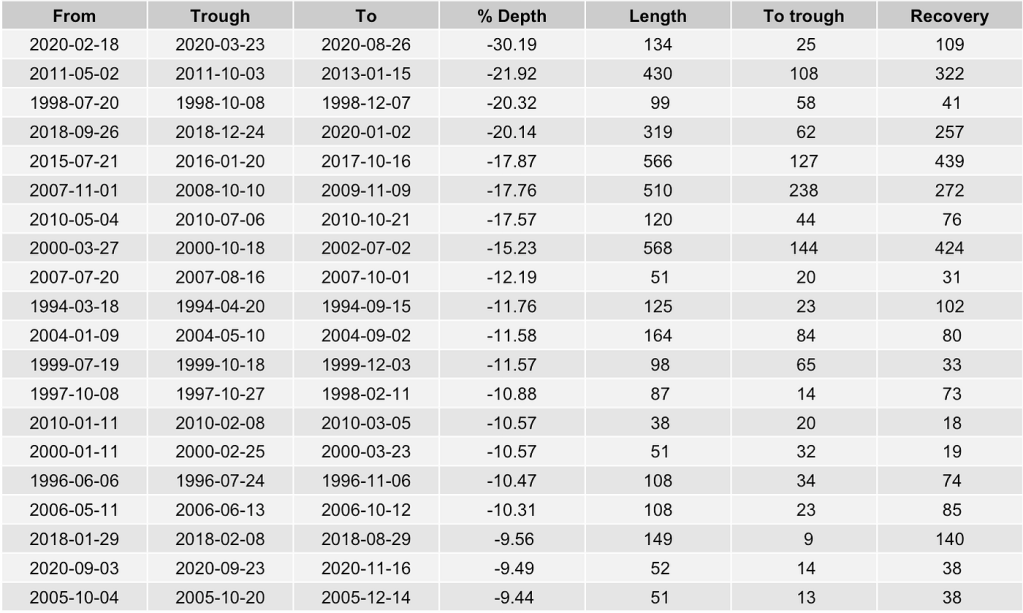
Historical drawdowns
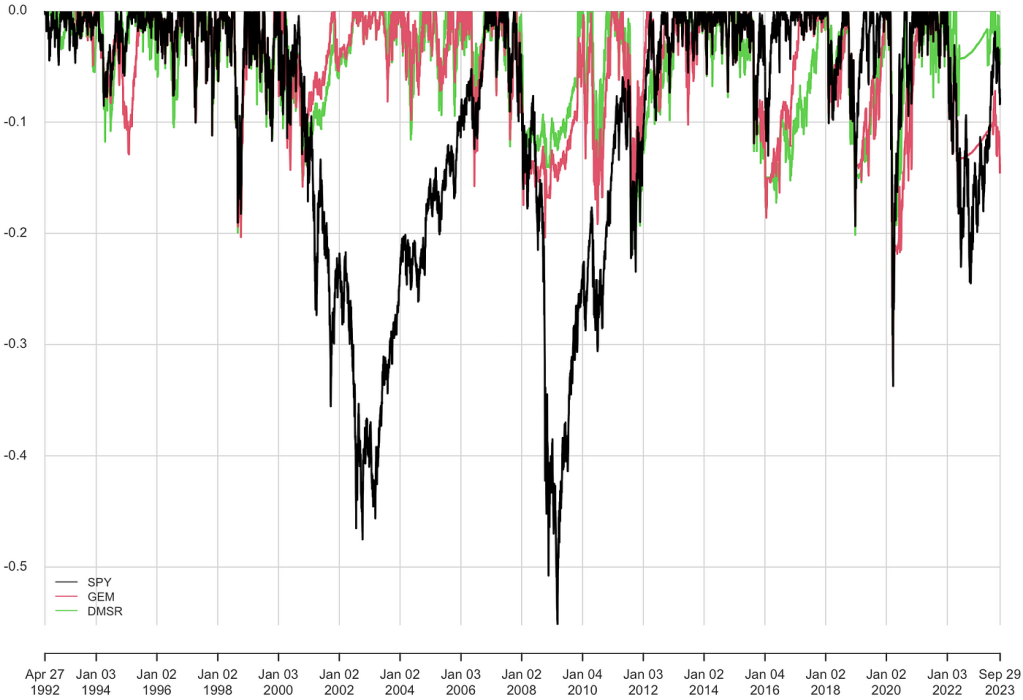
DMSR vs GEM vs S&P500 comparisons
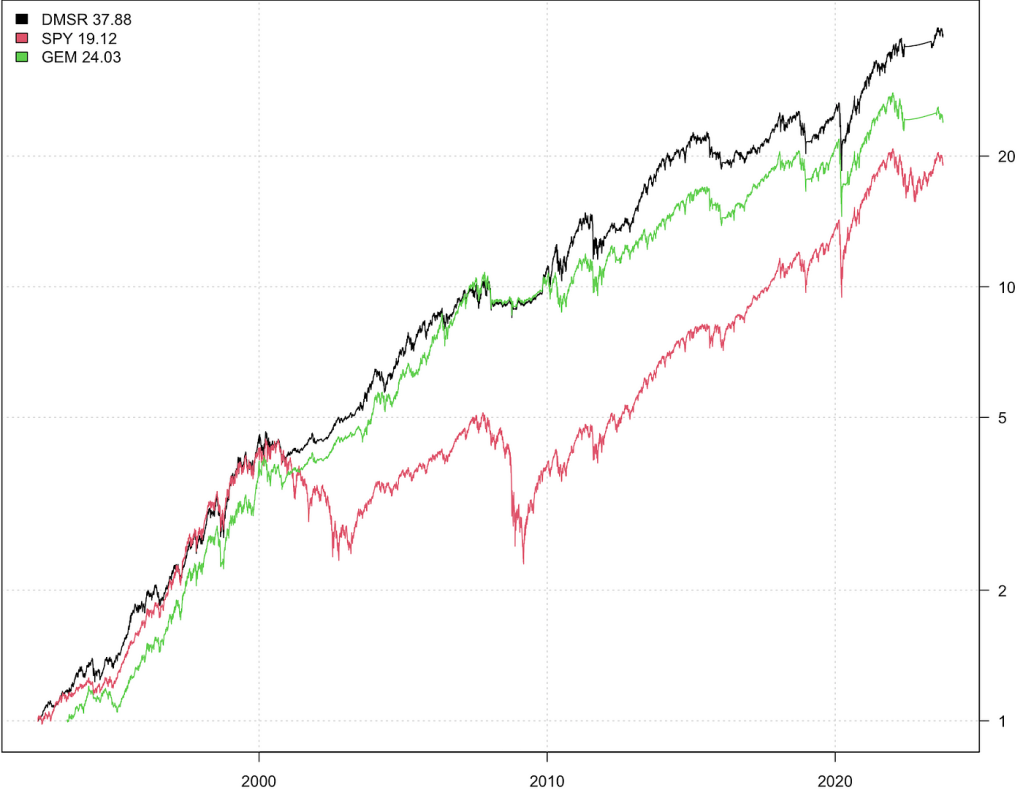
Comparison of GEM, DMSR and S&P500 strategies
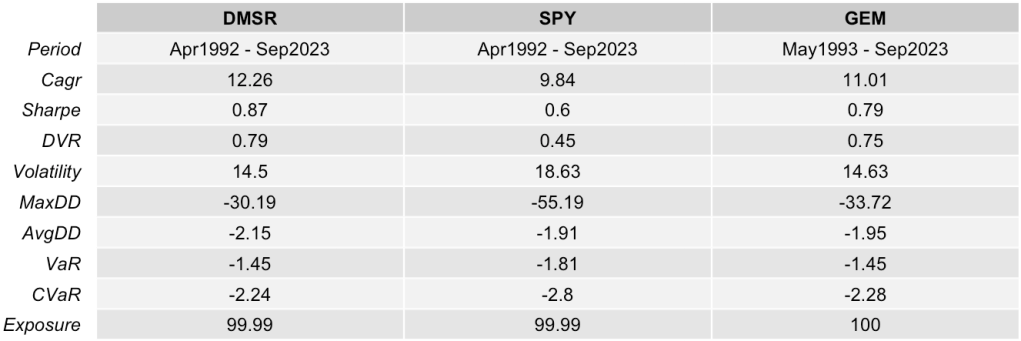
Statistics GEM, DMSR and S&P500
Drawdowns GEM, DMSR and S&P500
Comparison between DMSR and its asset classes
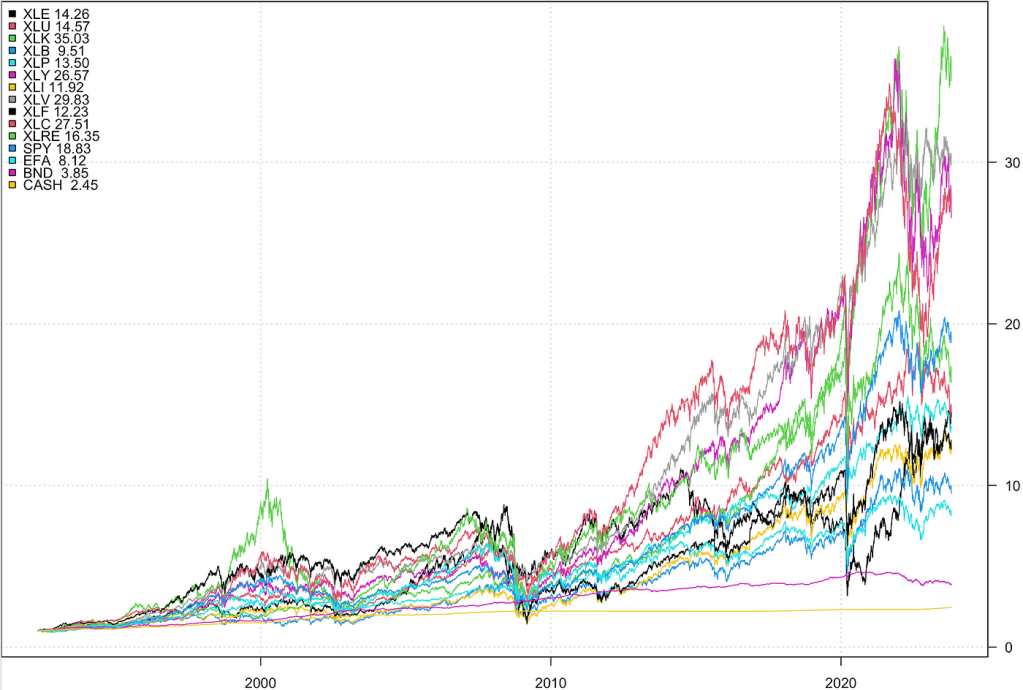
Cumulative historical performance of DMSR and its asset classes
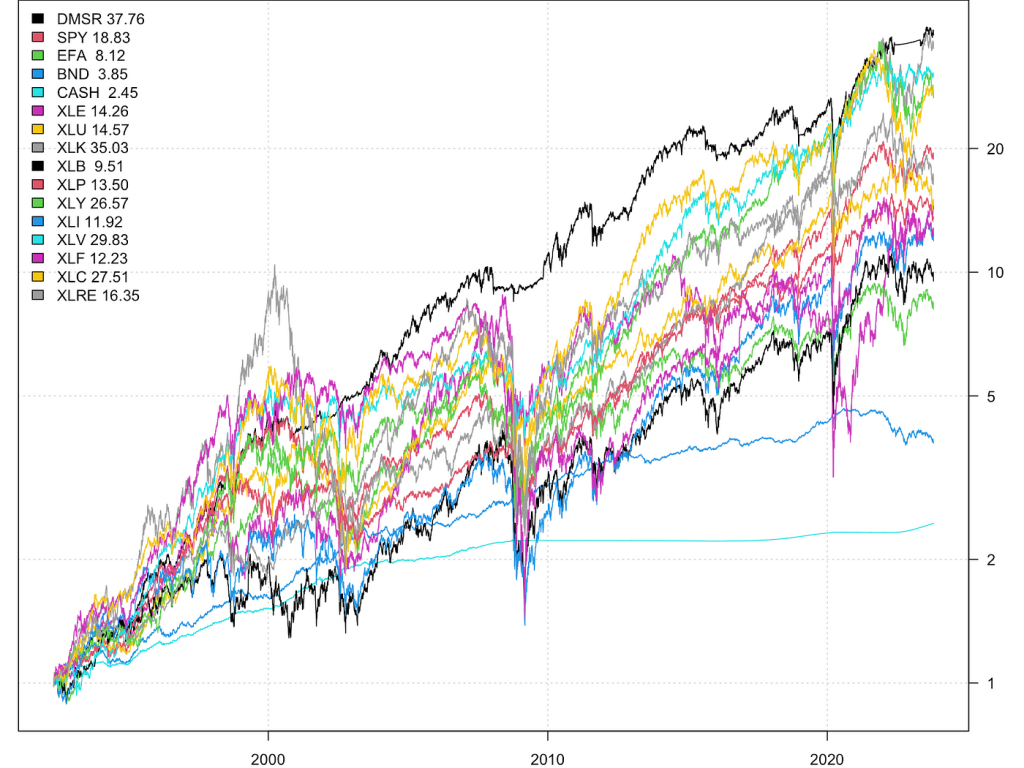
It is astonishing to see how the strategy is able to ‘ride’ the crest of its asset classes.
The statistical data is equally impressive.
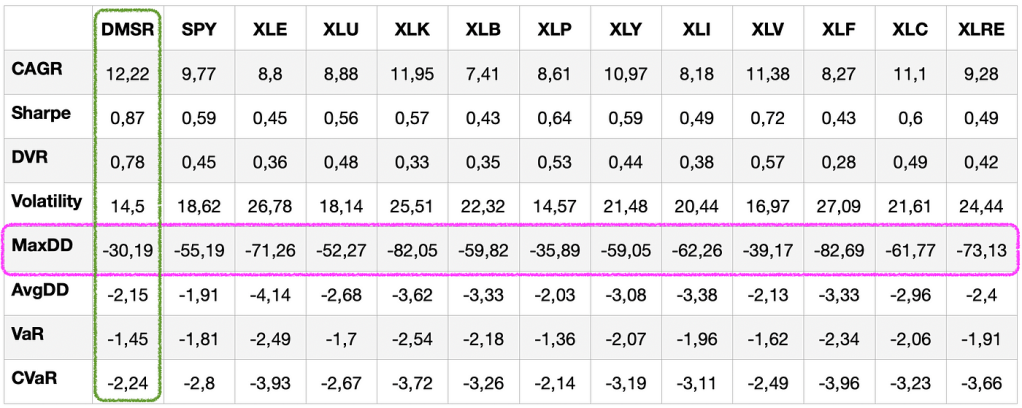
The average performance of DMSR is by far the highest at 12.22%, with a drawdown almost halved compared to its asset classes!
Simulation with random momentum
To make sure the strategy is stable and check that it is not subject to optimization, I have introduced some randomness in the calculations.
At the end of each month, momentum is calculated using a randomly defined historical length of between 3 and 18 months.
This random component, renewed at the end of each month when the momentum is calculated and the supports are selected, will randomly shift the timing of the strategy to
- determine whether the S&P 500 is bullish or bearish,
- select offensive stocks,
- select defensive stocks,
Historical performance of 50 DMSR strategies with random timing
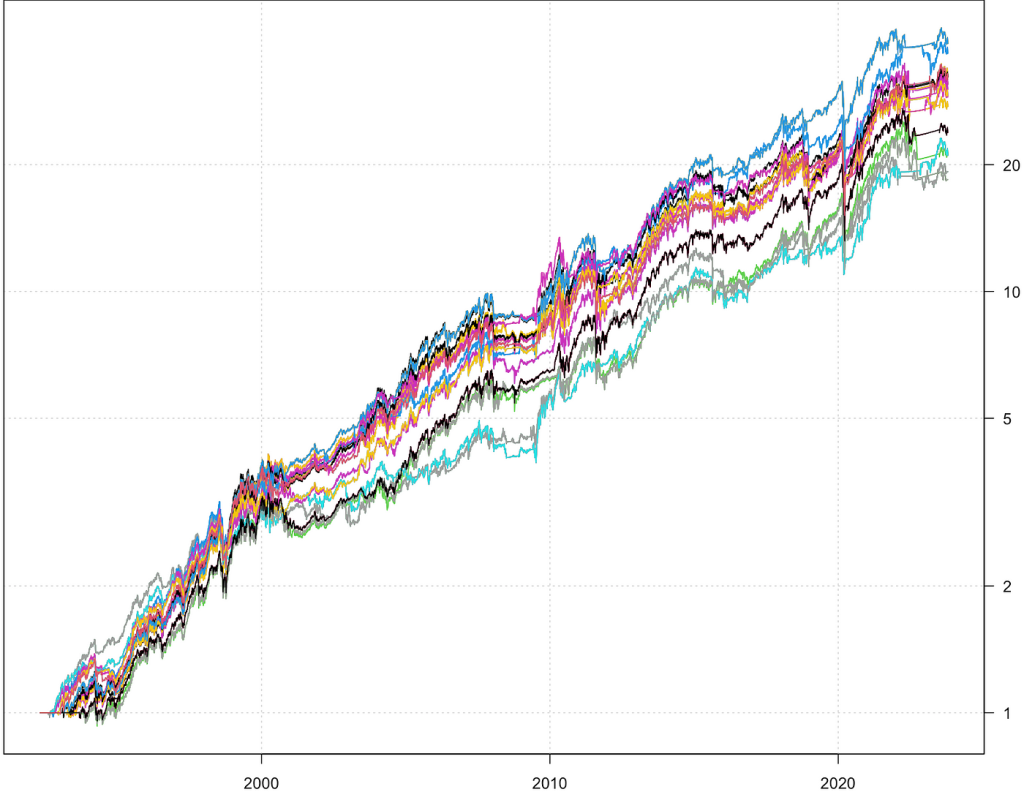
As we can see, the strategy is particularly solid and consistent, with a relatively limited dispersion.
I have also varied the number of offensive assets selected and replaced the calculation of momentum with moving averages. In all cases, the results remain consistent and the edge is well preserved.
Comments
The performance of this simple and confidential strategy is particularly attractive.
By investing in S&P500 sectors rather than the index itself, we can filter out the sectors that are suffering.
If we rank these sectors according to their annual performance, we can see very clearly that rotation is important. The DMSR exploits these rotations by selecting only those sectors with a positive trend.
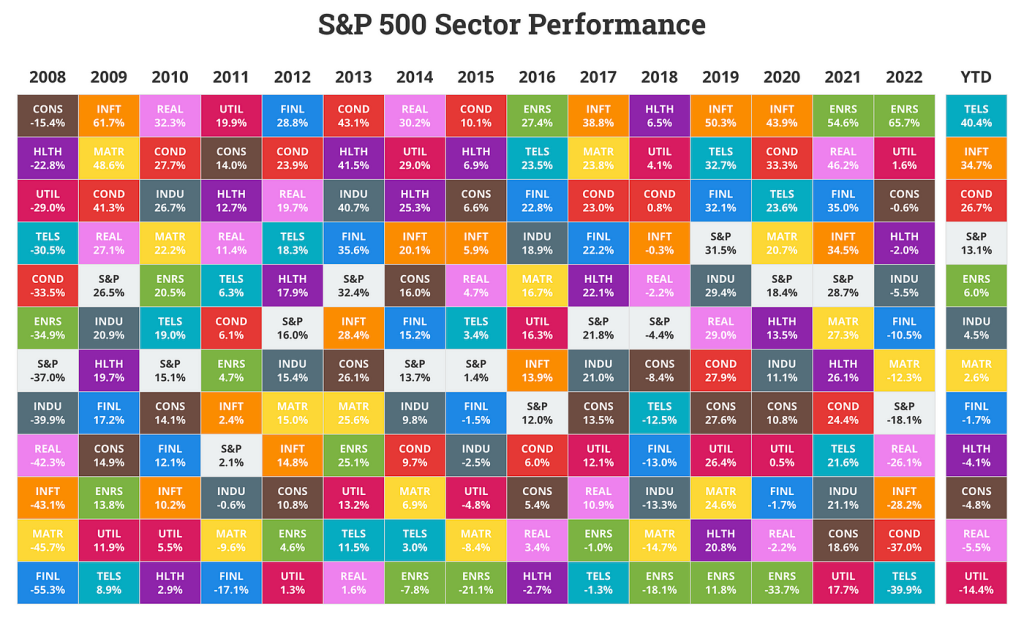
Longer-term cycles also emerge if we look at sector families: cyclical, defensive, offensive, with slower rotations extending over several years. The strategy also benefits from these longer-term rotations.
Gary Antonacci also makes an interesting point about another aspect of the strategy:
« DMSR can also reduce portfolio risk exposure by rotating into defensive sectors, such as consumer defensive and utilities, prior to market tops. These defensive sectors often hold up well following market tops and before trend-following absolute momentum can kick in and take us out of all equity positions. »
Miscellaneous
Market data at September 30, 2023
Simulations carried out in R using daily data
If you wish to contact me: https://nlxtech.com or LinkedIn.
Do not hesitate to Like or Share if you appreciate this article.
Disclaimer
This article expresses my personal views on a variety of subjects, including the economy and financial portfolio management. Nothing in my articles should be construed as personal investment advice. I am not a financial adviser. You are responsible for your own actions and should always seek advice from qualified people about your own situation. This article is for information purposes only. You must do your own research and make your own choices, with your own money, based on your particular situation. The performances presented are mostly simulated and are not intended to reflect the real situation. They do not reflect transaction costs, taxes, management fees or other expenses. Hypothetical performance results are presented for illustrative purposes only and should not be construed as an indication of future performance. Past performances are not necessarily indicative of future results. Any opinions, research, analysis, prices or other information contained in this article are provided as commentary and illustration of the publications in this article and do not constitute investment advice. Certain links lead to other articles or websites for the purpose of sharing information. The inclusion of these links does not imply an endorsement of the opinions or advice of the other sites.

Laisser un commentaire